


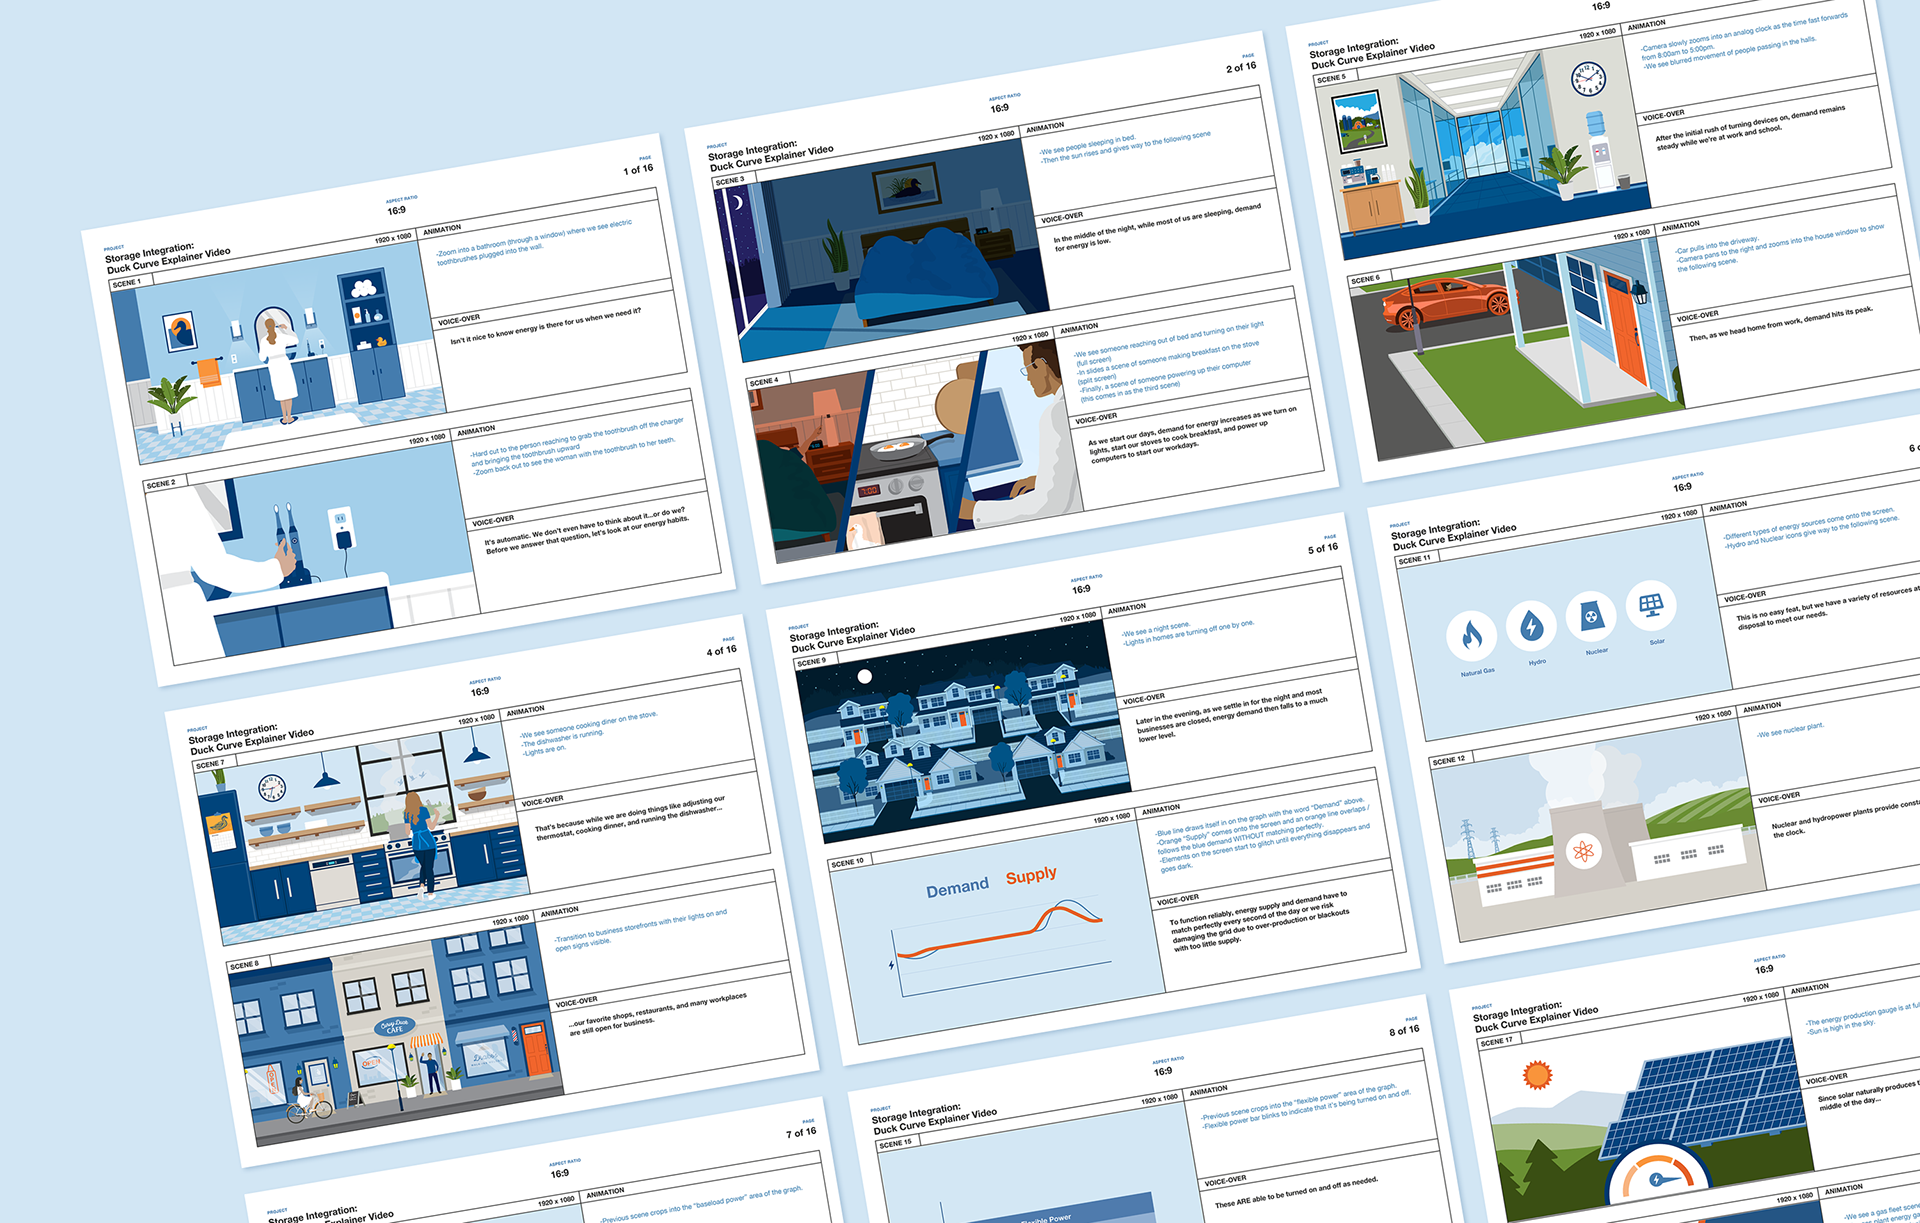


While working with TVA's Storage Integration team, we identified the need to explain a complex energy challenge that can be addressed through energy storage using an animated video. There is an imbalance between electricity demand and the amount of available solar energy throughout the day. When this load imbalance is shown in a graph, it creates a curve — known by the industry as the duck curve. Our team collaborated with our clients to develop a script that explains the duck curve in a simplified manner and then created accompanying illustrations. Watch the completed product below to see how our team translated this technical subject into an easy-to-understand, engaging video. ---- Motion Graphics by Eric Van Buskirk Illustrations by Richard Longhi Art Direction by Julia Perry